
About our maps
We draw our own maps. Every colour, every line weight, every point of interest is chosen to answer one question: what does a cyclist need to see?
Oasis in the desert
Section titled “Oasis in the desert”A city, seen through the eyes of a cyclist, is mostly car infrastructure. We call that the desert. Scattered through it are oases — places where you can ride without thinking about traffic. A separated bike path along the river. A trail through the woods. A quiet lane that connects two neighbourhoods. These are the places where cycling feels like what it is: freedom.
The map is built around two questions.
Can I ride here without worrying about cars?
Section titled “Can I ride here without worrying about cars?”We use colour to answer this at a glance:
-
Oasis (teal). Separated from car traffic. Dedicated cycleways, multi-use paths, bike trails. Bold, visible from the widest zoom levels.
-
Exposed (muted teal, dashed in high contrast). On-road bike lanes. Rideable, but you’re sharing space with cars.
-
Desert (pale earth tones). Car roads. Present for orientation — you need to know where the streets are — but visually quiet. Not hidden, just not the focus.
The mental test: does riding here feel calm enough that traffic fades from your mind? That feeling — not a literal safety rating, just that sense of being somewhere designed for you — is what makes something an oasis.
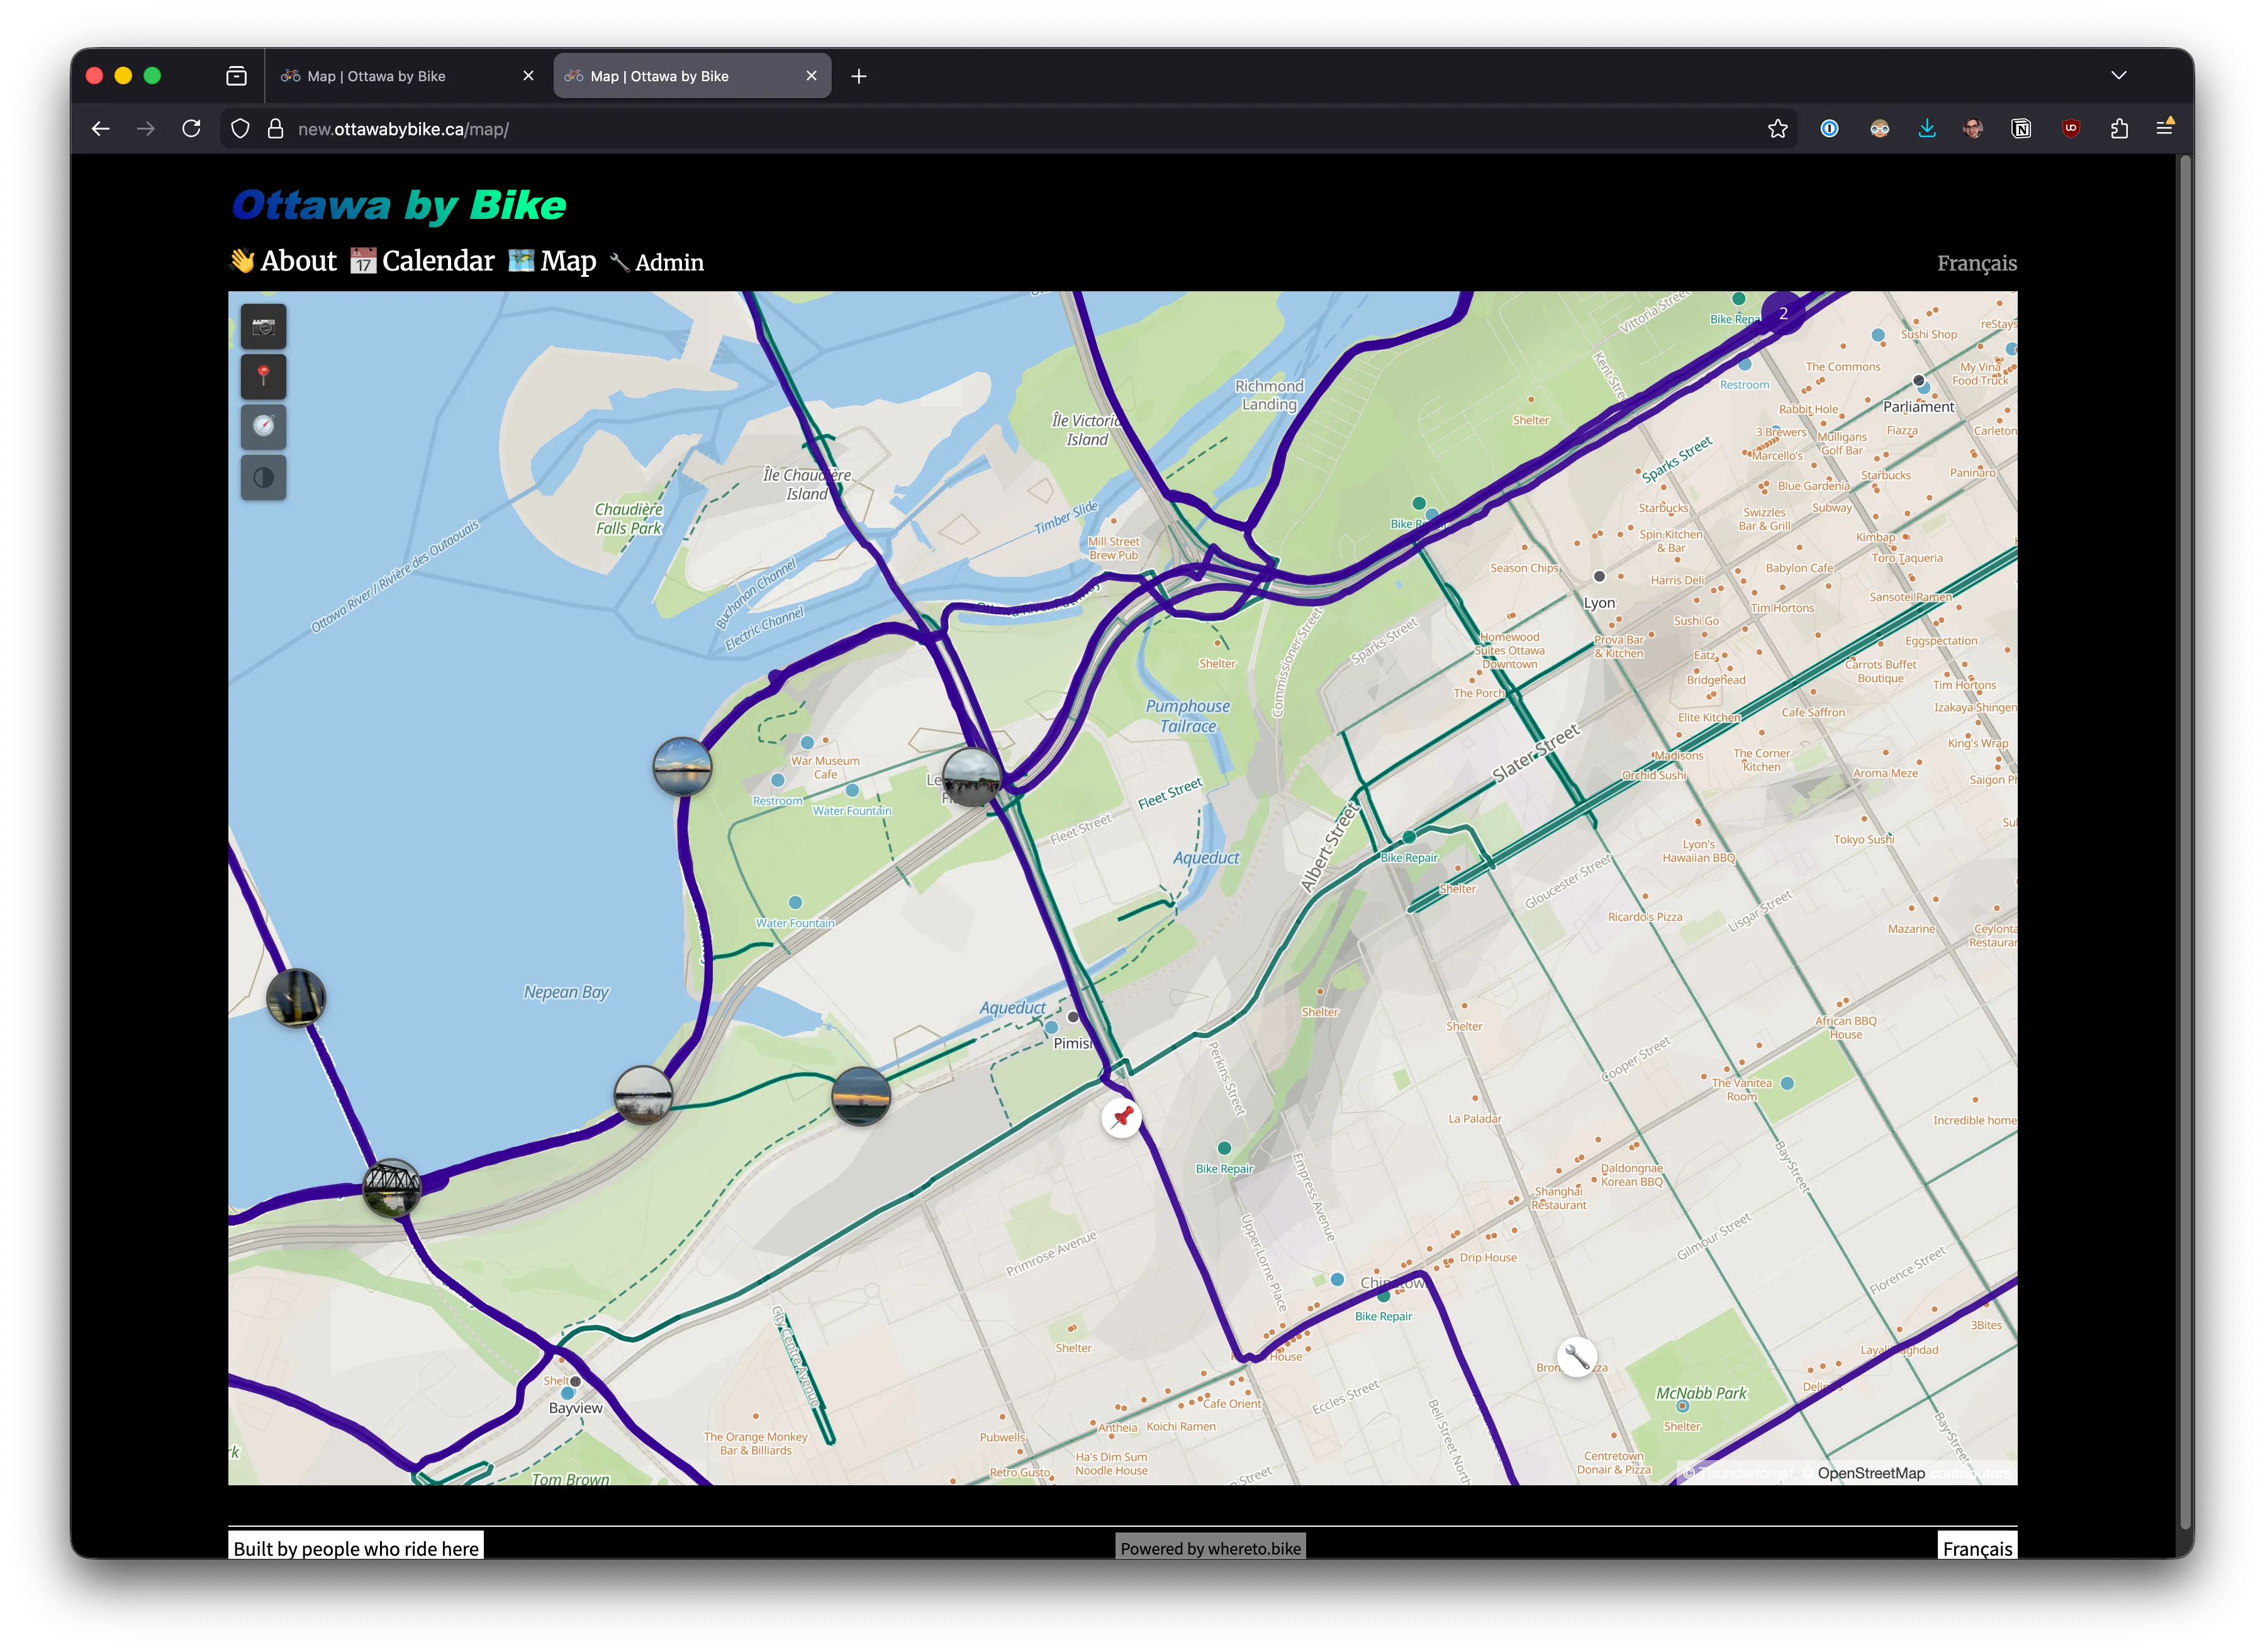
Here’s what that looks like. The teal cycling network becomes the dominant visual layer, while car roads recede into warm earth tones:
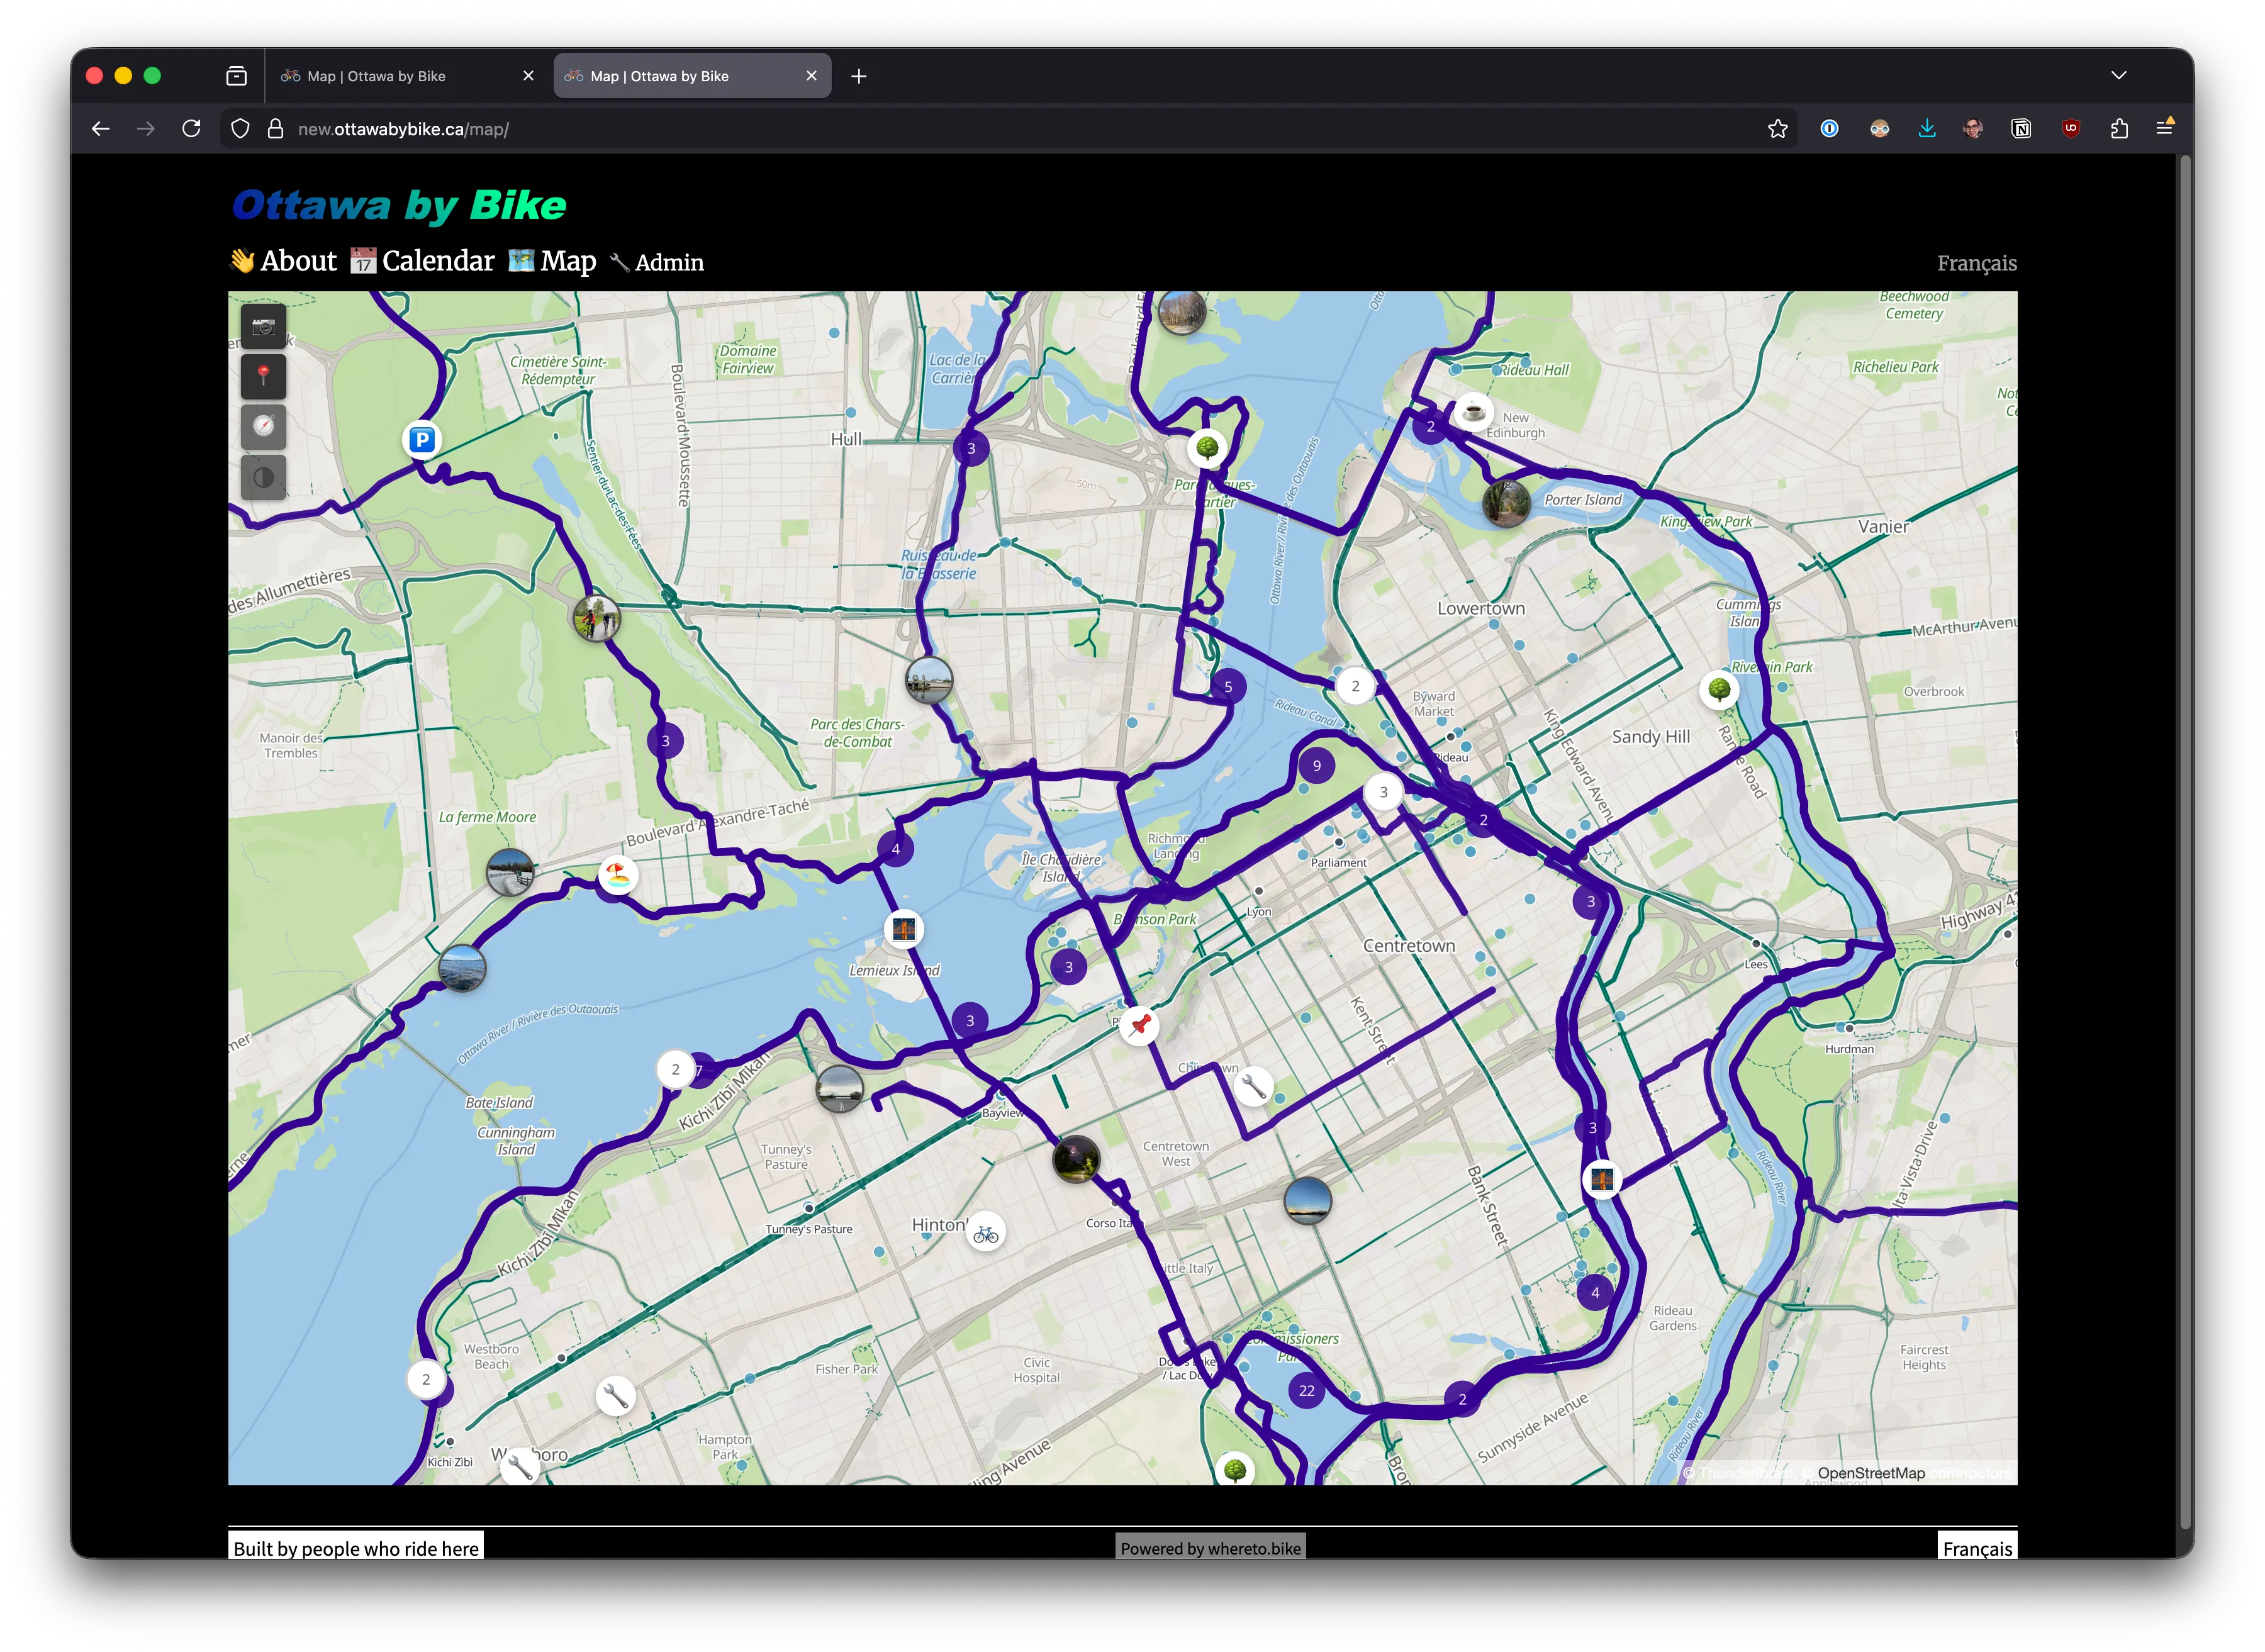
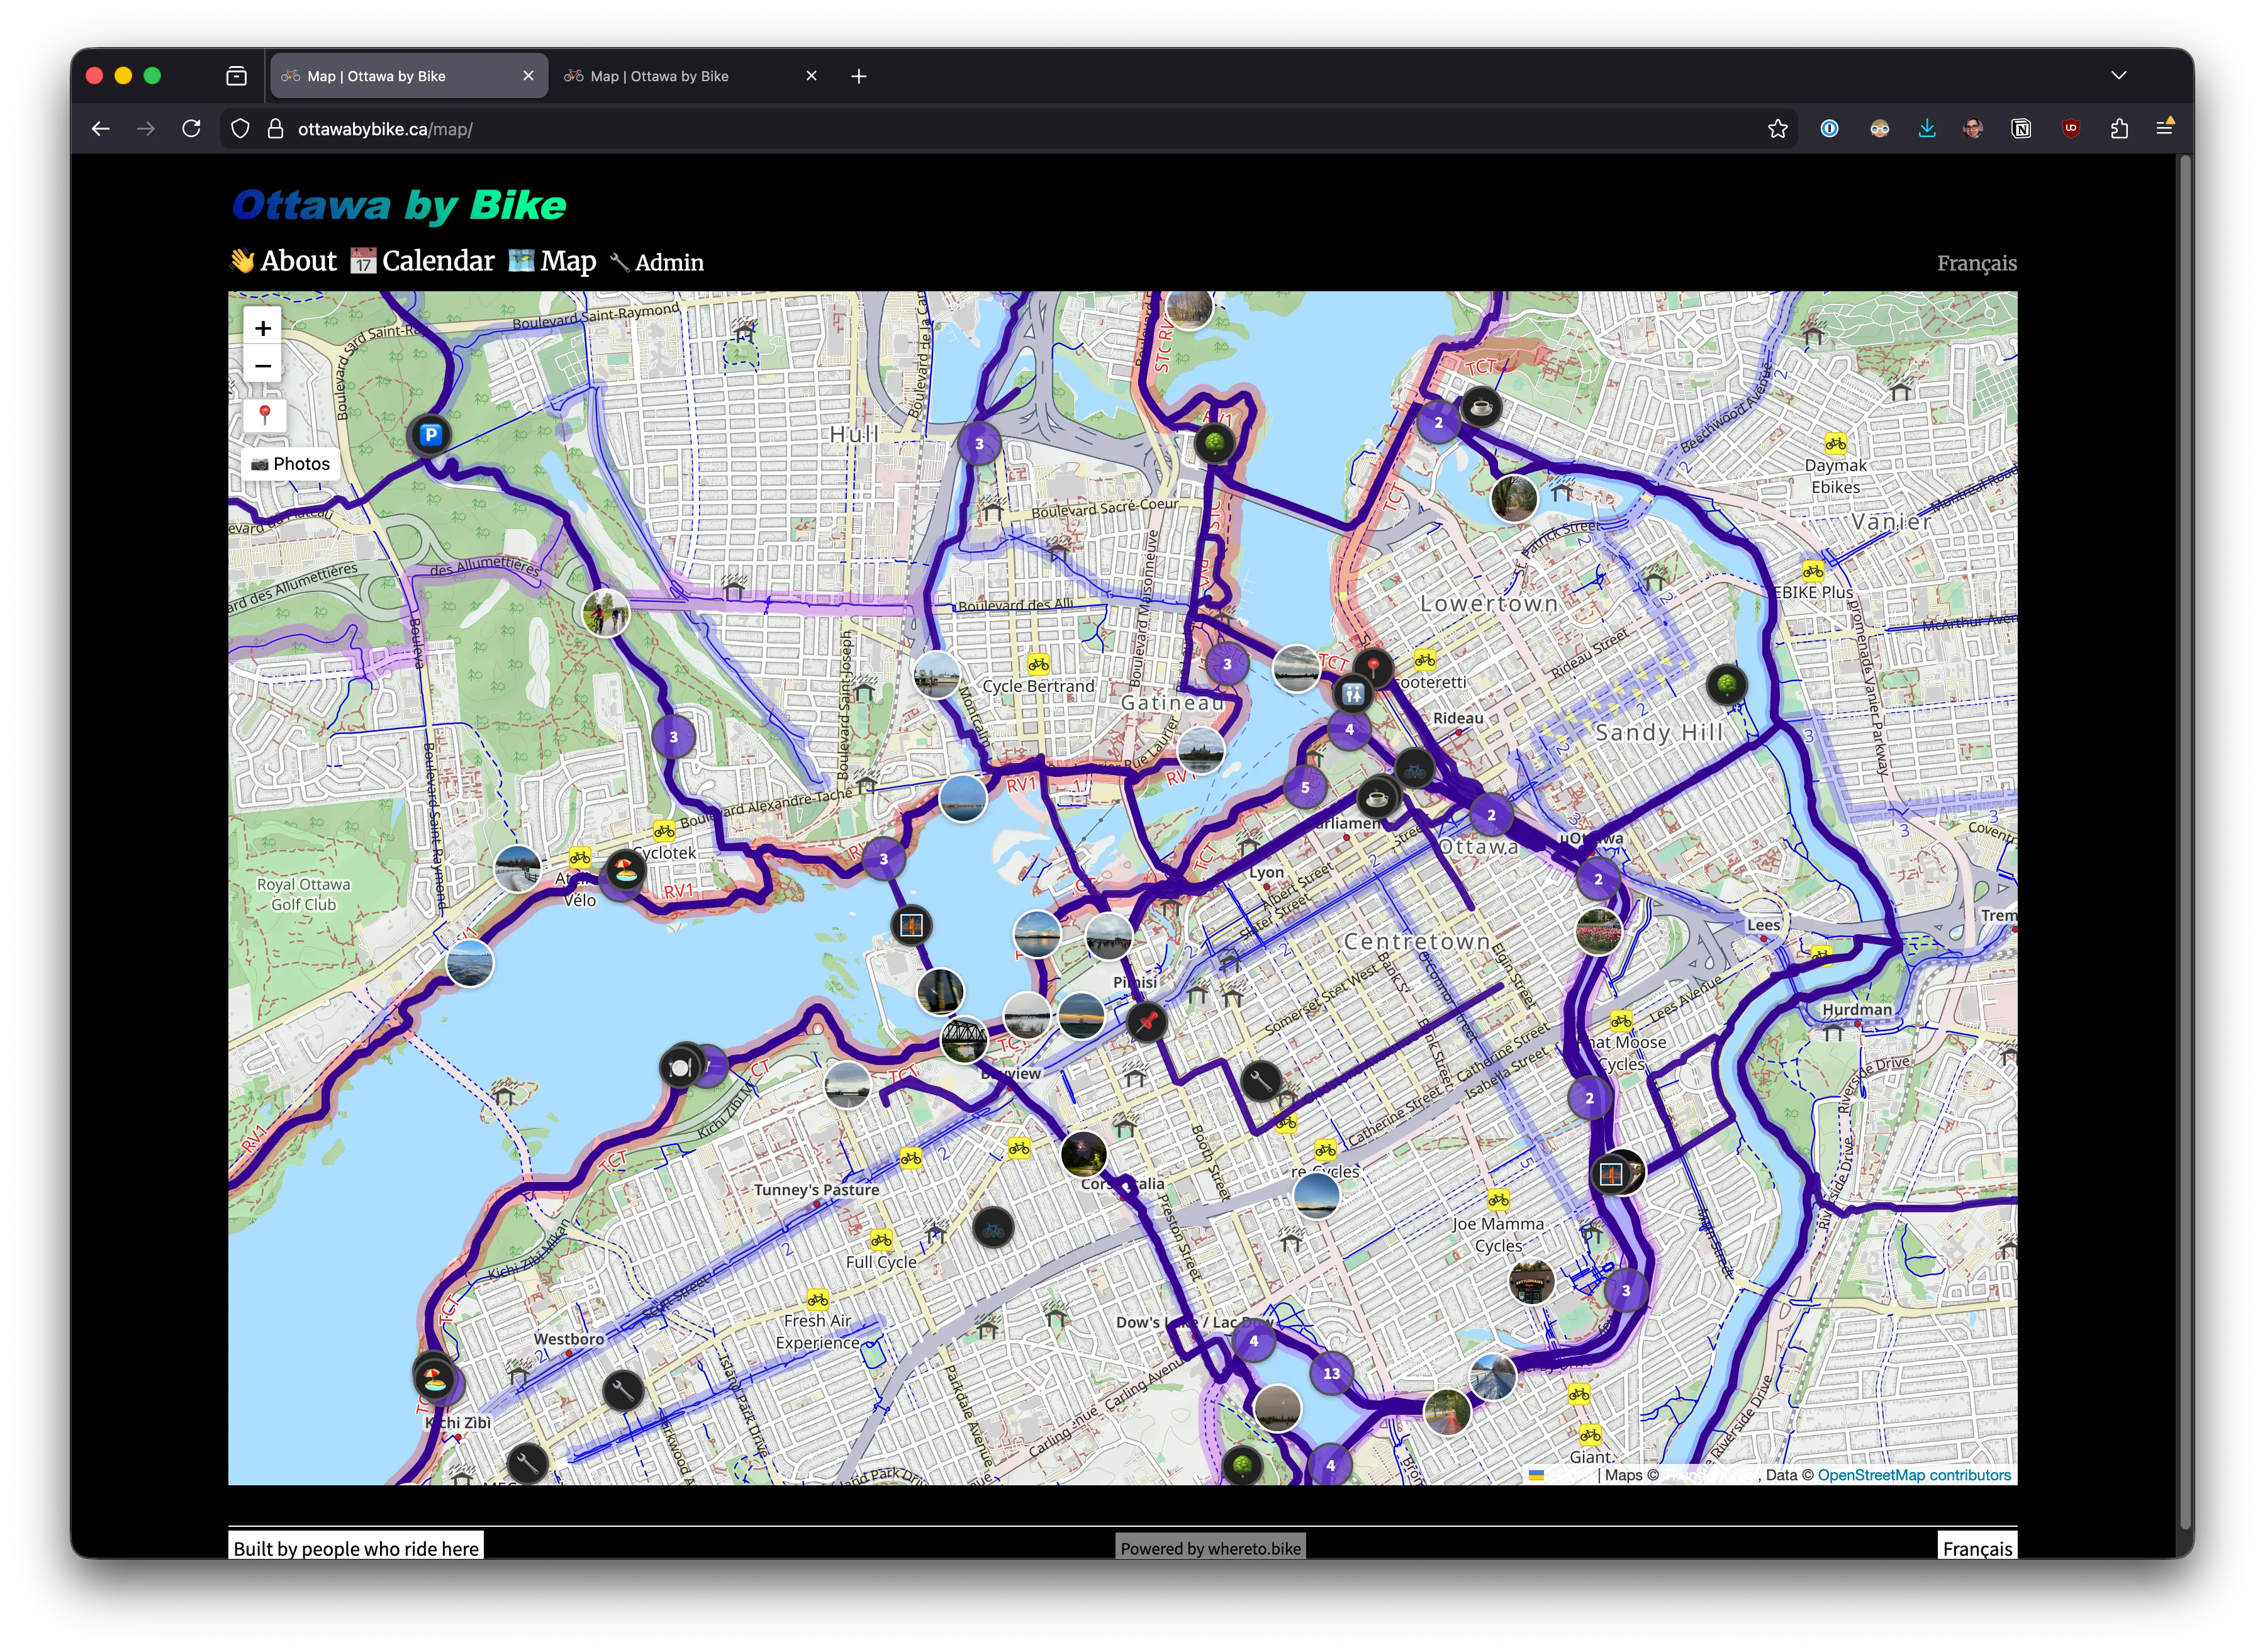
Compare with the same area on standard map tiles, where cycling infrastructure competes with every other map feature for attention:
Can I stop here?
Section titled “Can I stop here?”Long rides need stops. We prioritise them by how critical they are mid-ride:
-
Water and restrooms (blue dots, visible from zoom level 10). On a hot day, knowing where the next water fountain is changes everything.
-
Camping (orange dots, visible from the widest zoom). When you’re planning a multi-day ride, you need to see where you can sleep before you zoom in anywhere.
-
Food and lodging (orange dots, visible from zoom level 15). Restaurants, cafes, hotels, shelters. Useful when you’re close, not when you’re planning from far away.
-
Bike infrastructure (teal dots). Shops, rental stations, repair stands. Same colour family as oasis — part of the cycling ecosystem.
Fewer categories, less noise
Section titled “Fewer categories, less noise”A gravel trail, a mountain bike track, and a hiking path with bike access all get the same teal. The question is always the same: can I bike here? If yes, it’s an oasis. Surface details belong in the route description, not on the map.
Twelve colour categories for different path types would be a reference poster, not a tool for riding. We’d rather a map you can read at a glance.
Zooming in
Section titled “Zooming in”At the city scale, the difference becomes even clearer. Downtown Ottawa — the standard tiles show a dense grid of roads, blue cycling icons, and labels all competing for space:
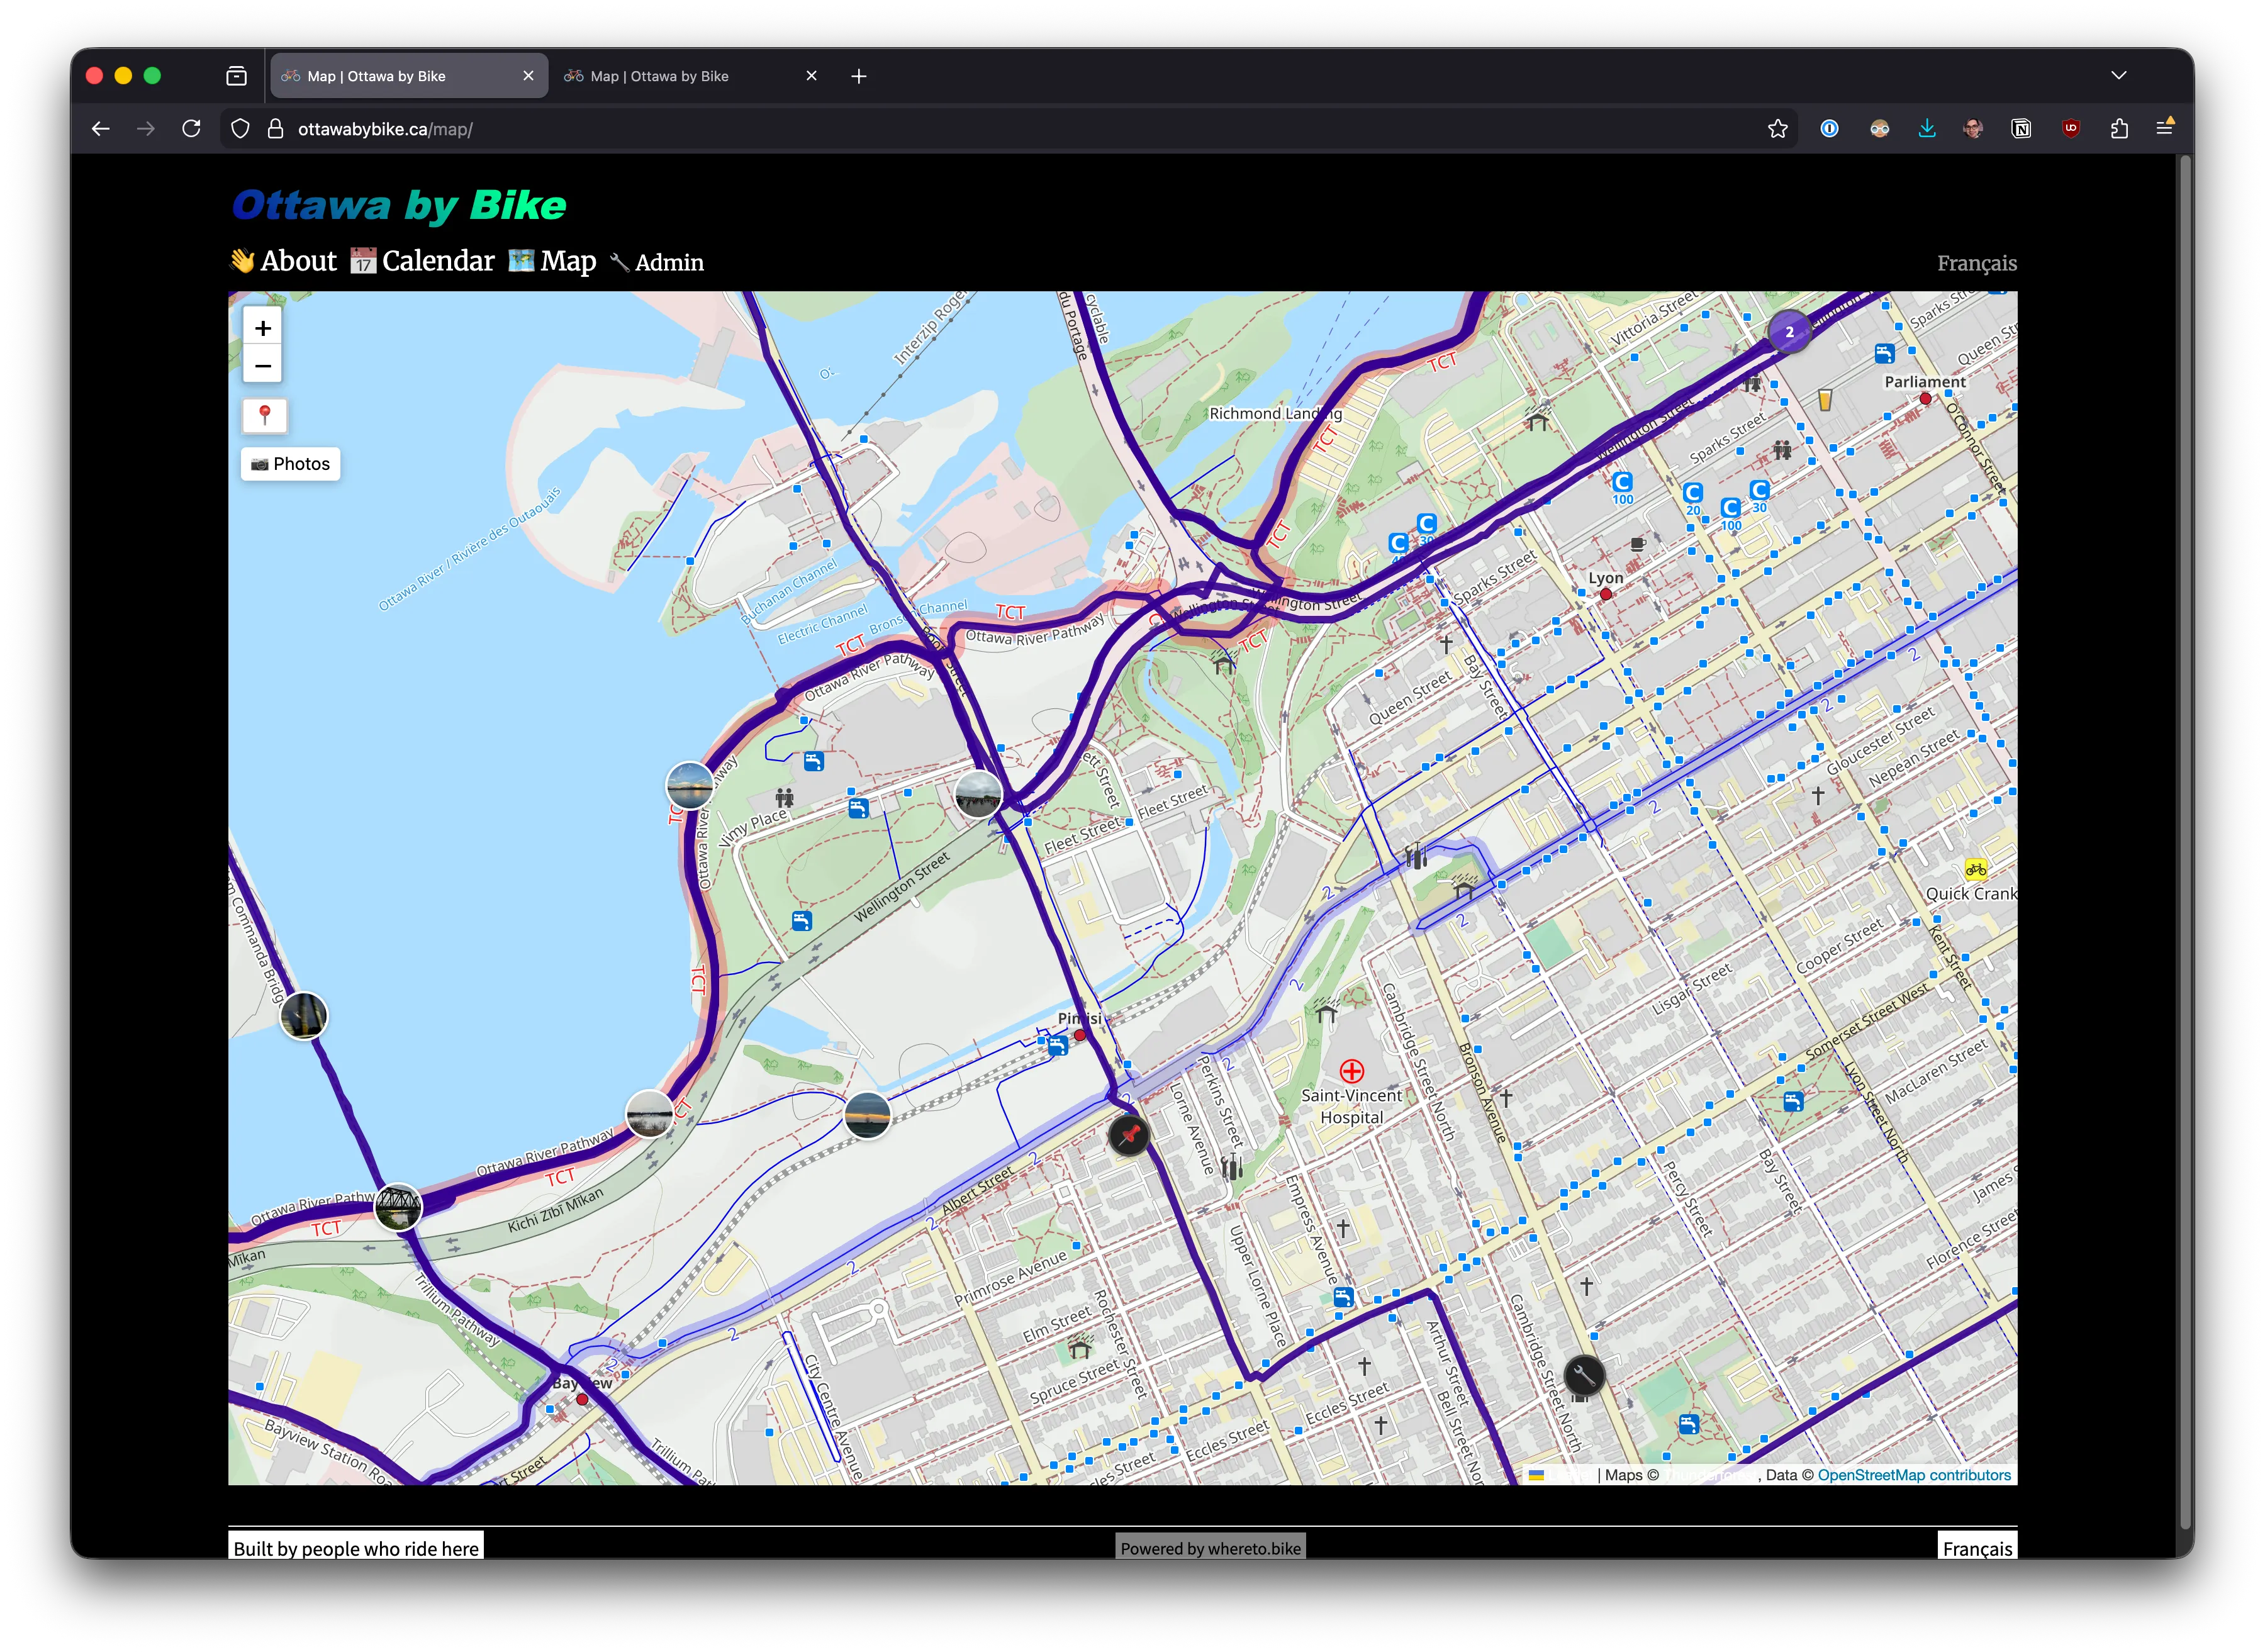
The custom style on the same area. Car roads fade. The teal cycling paths along the canal and through the islands read immediately:
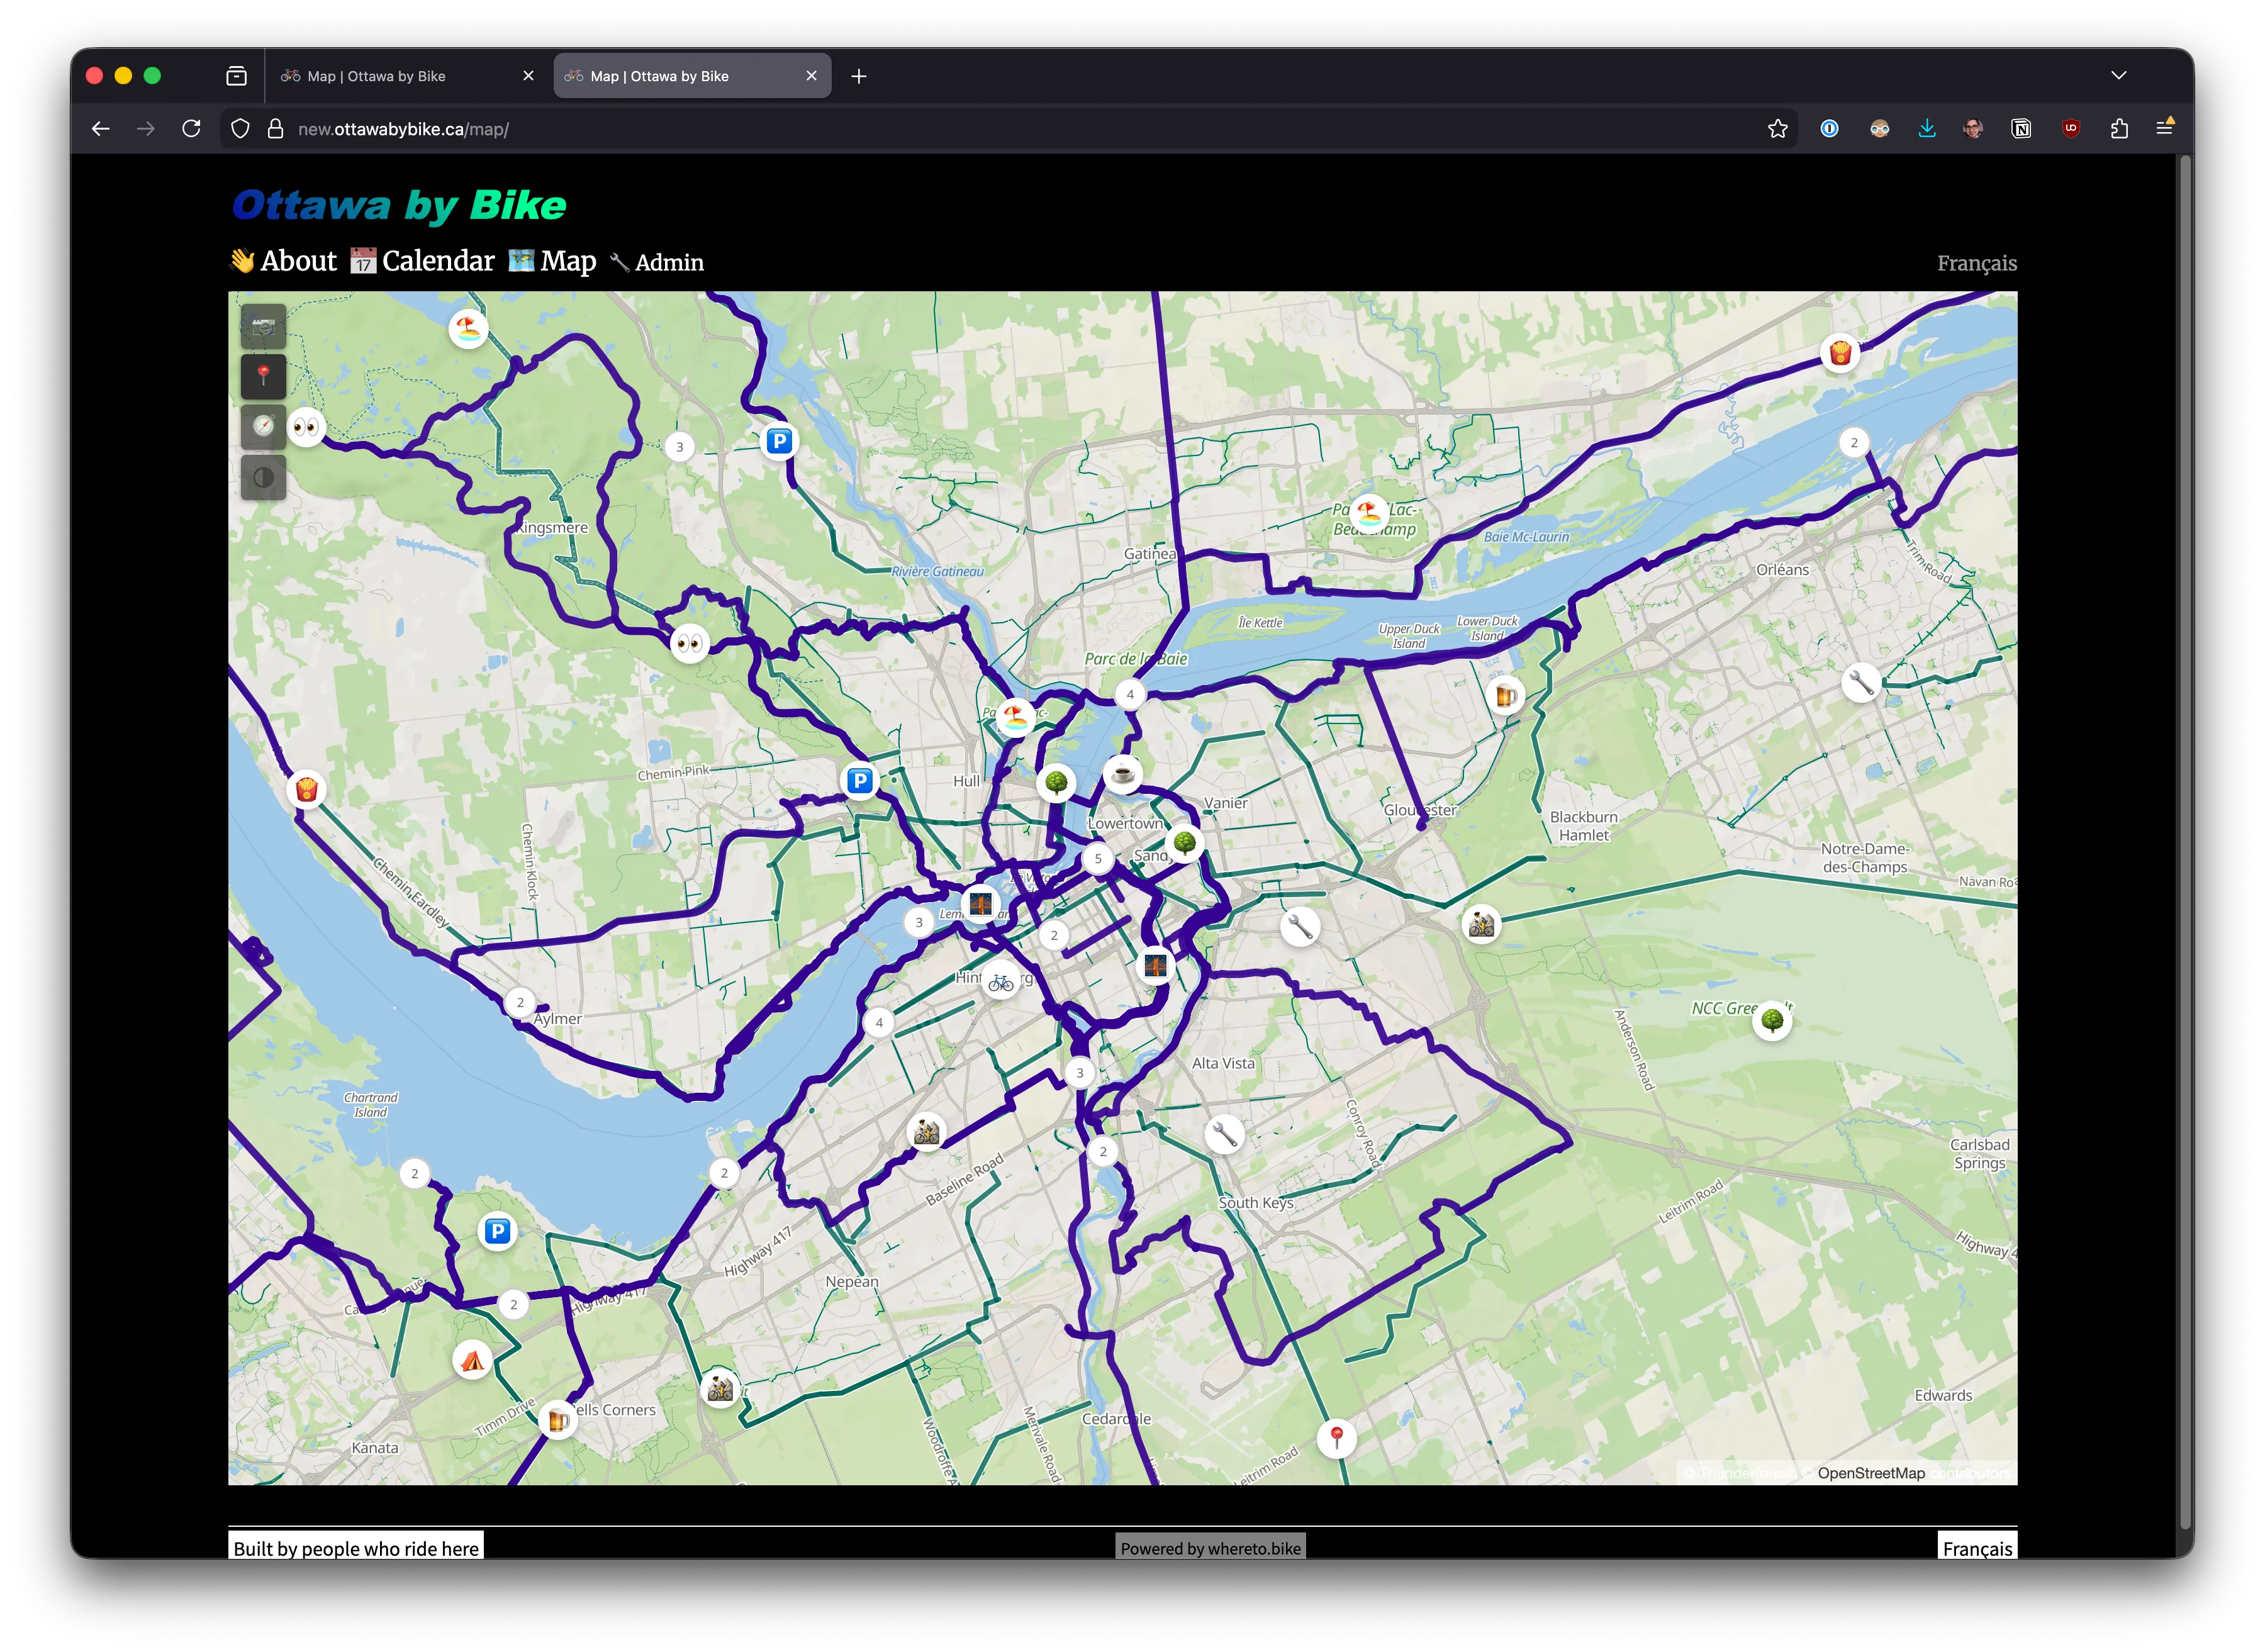
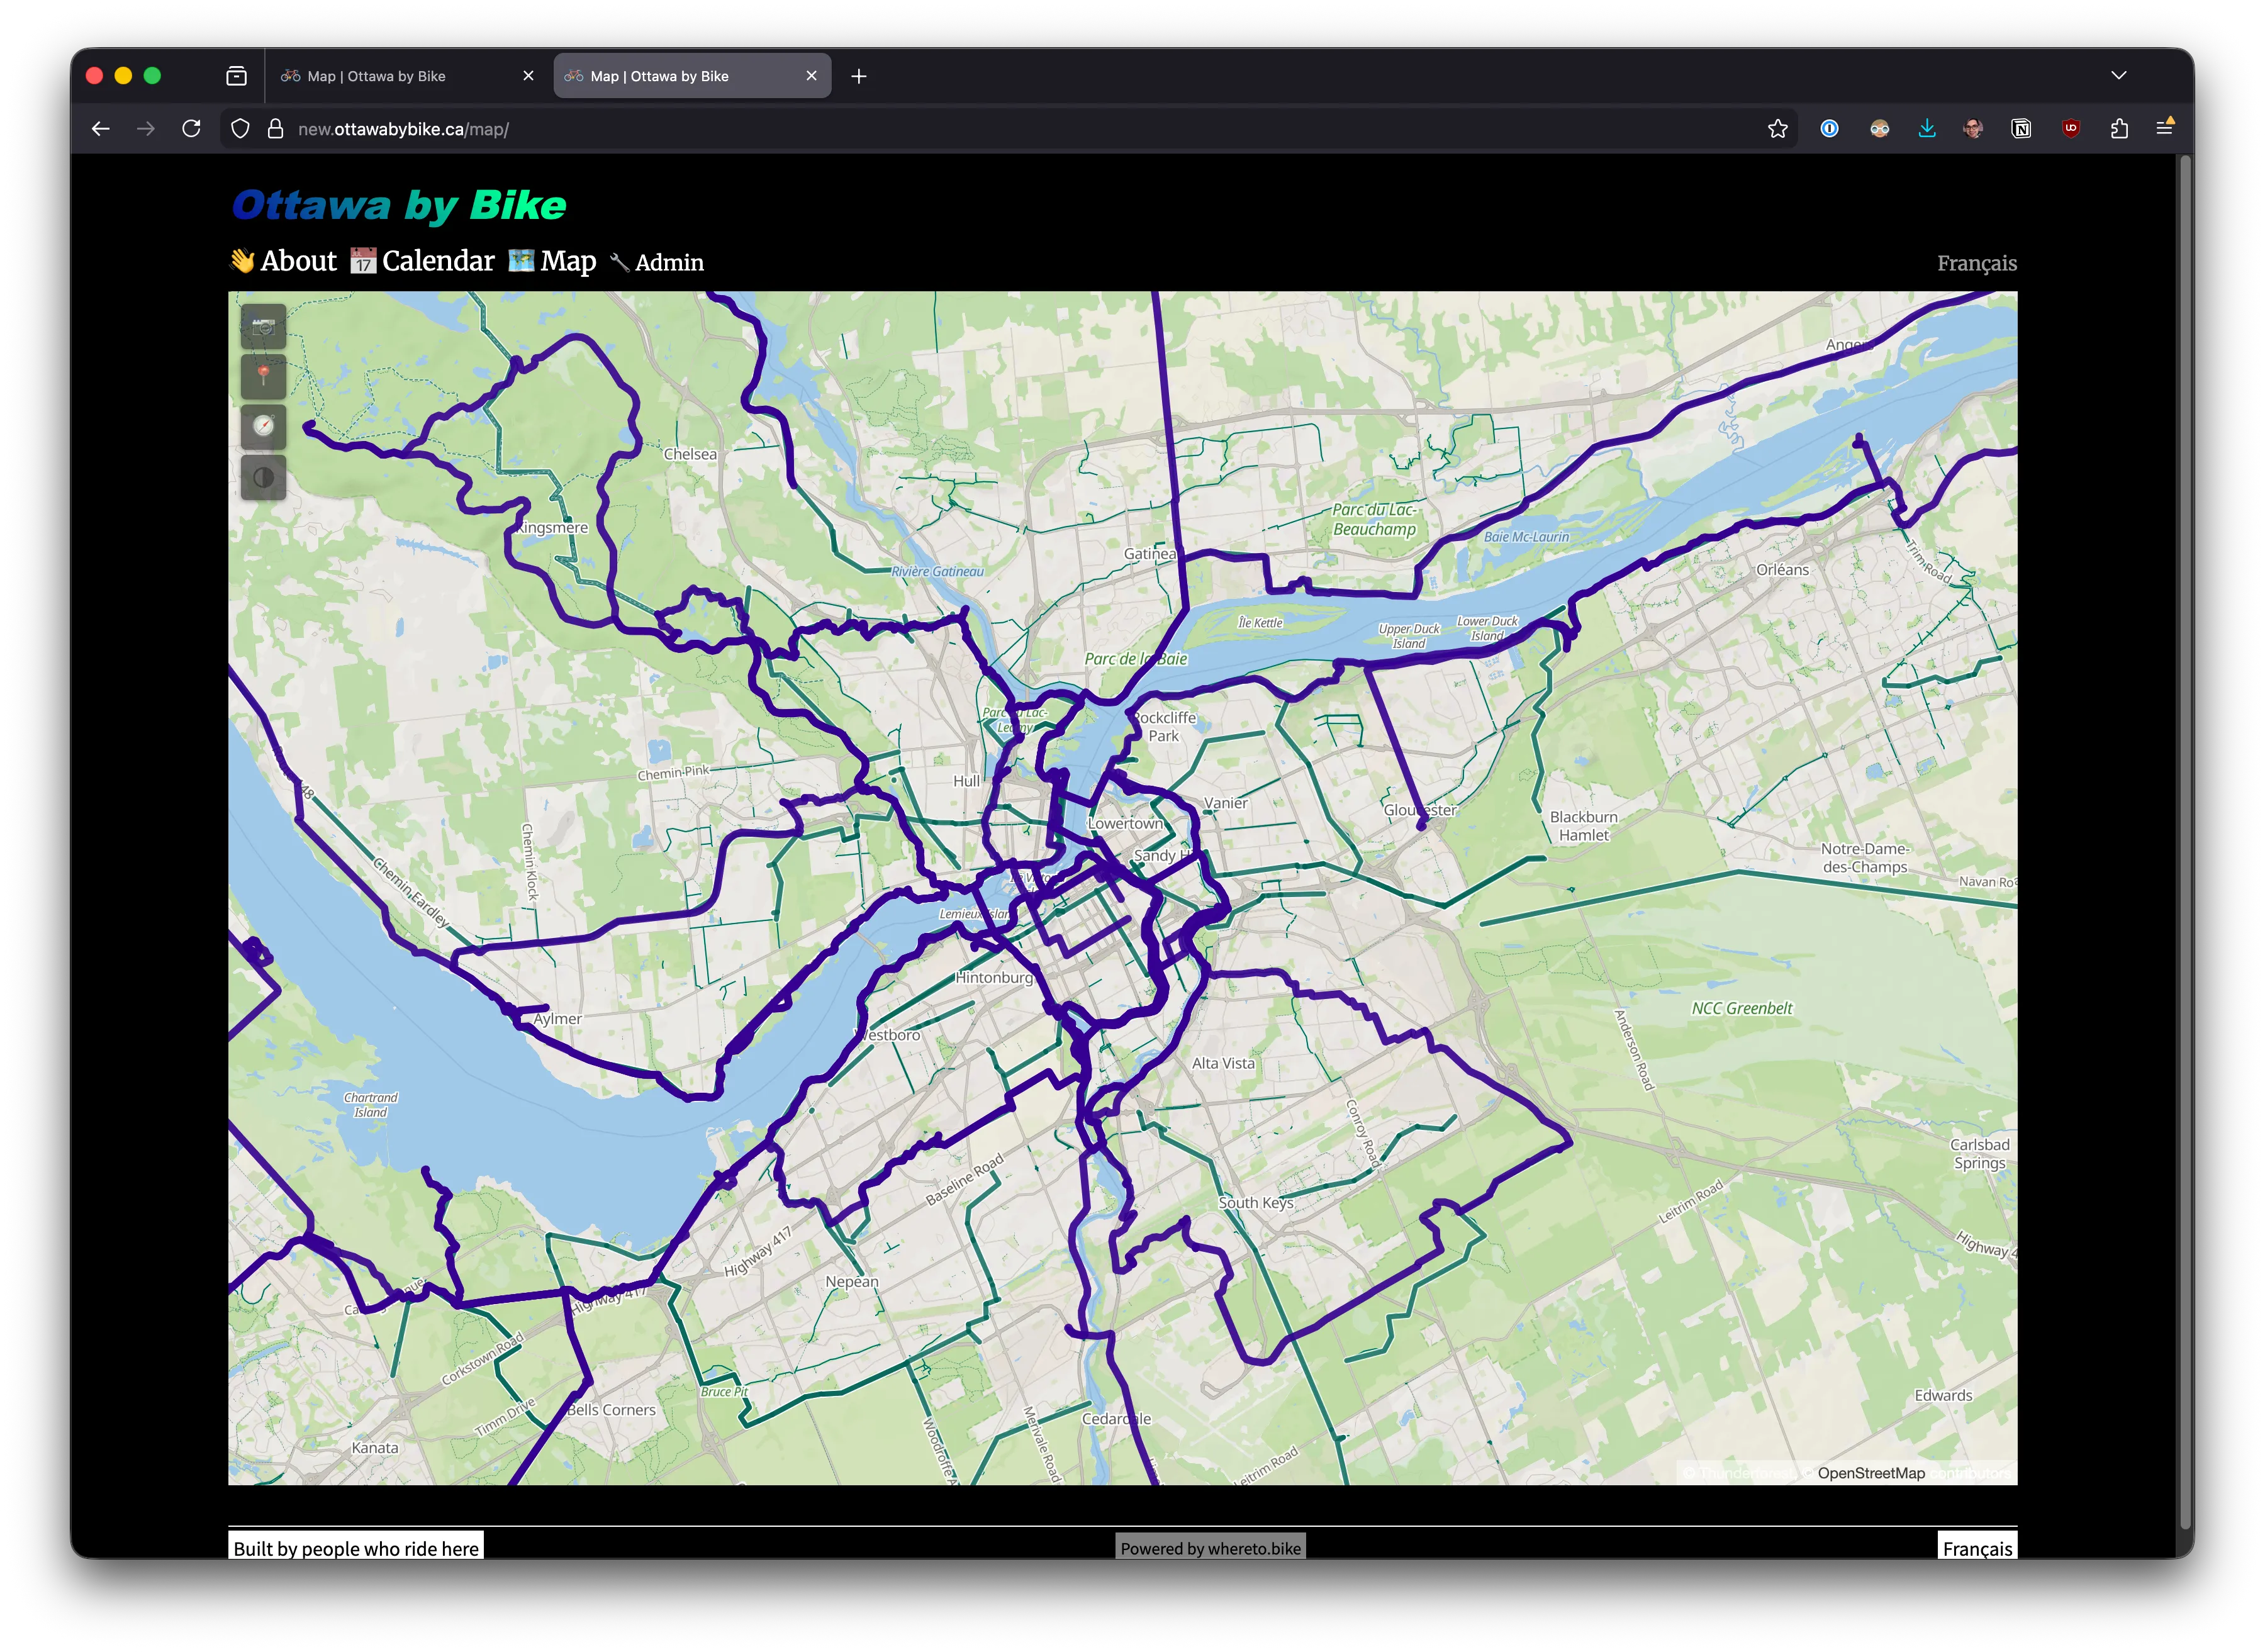
The wide view
Section titled “The wide view”Zoomed out to the region, the custom style shows the full cycling network as a connected system. Routes, paths, and trails form a web of teal across the landscape:
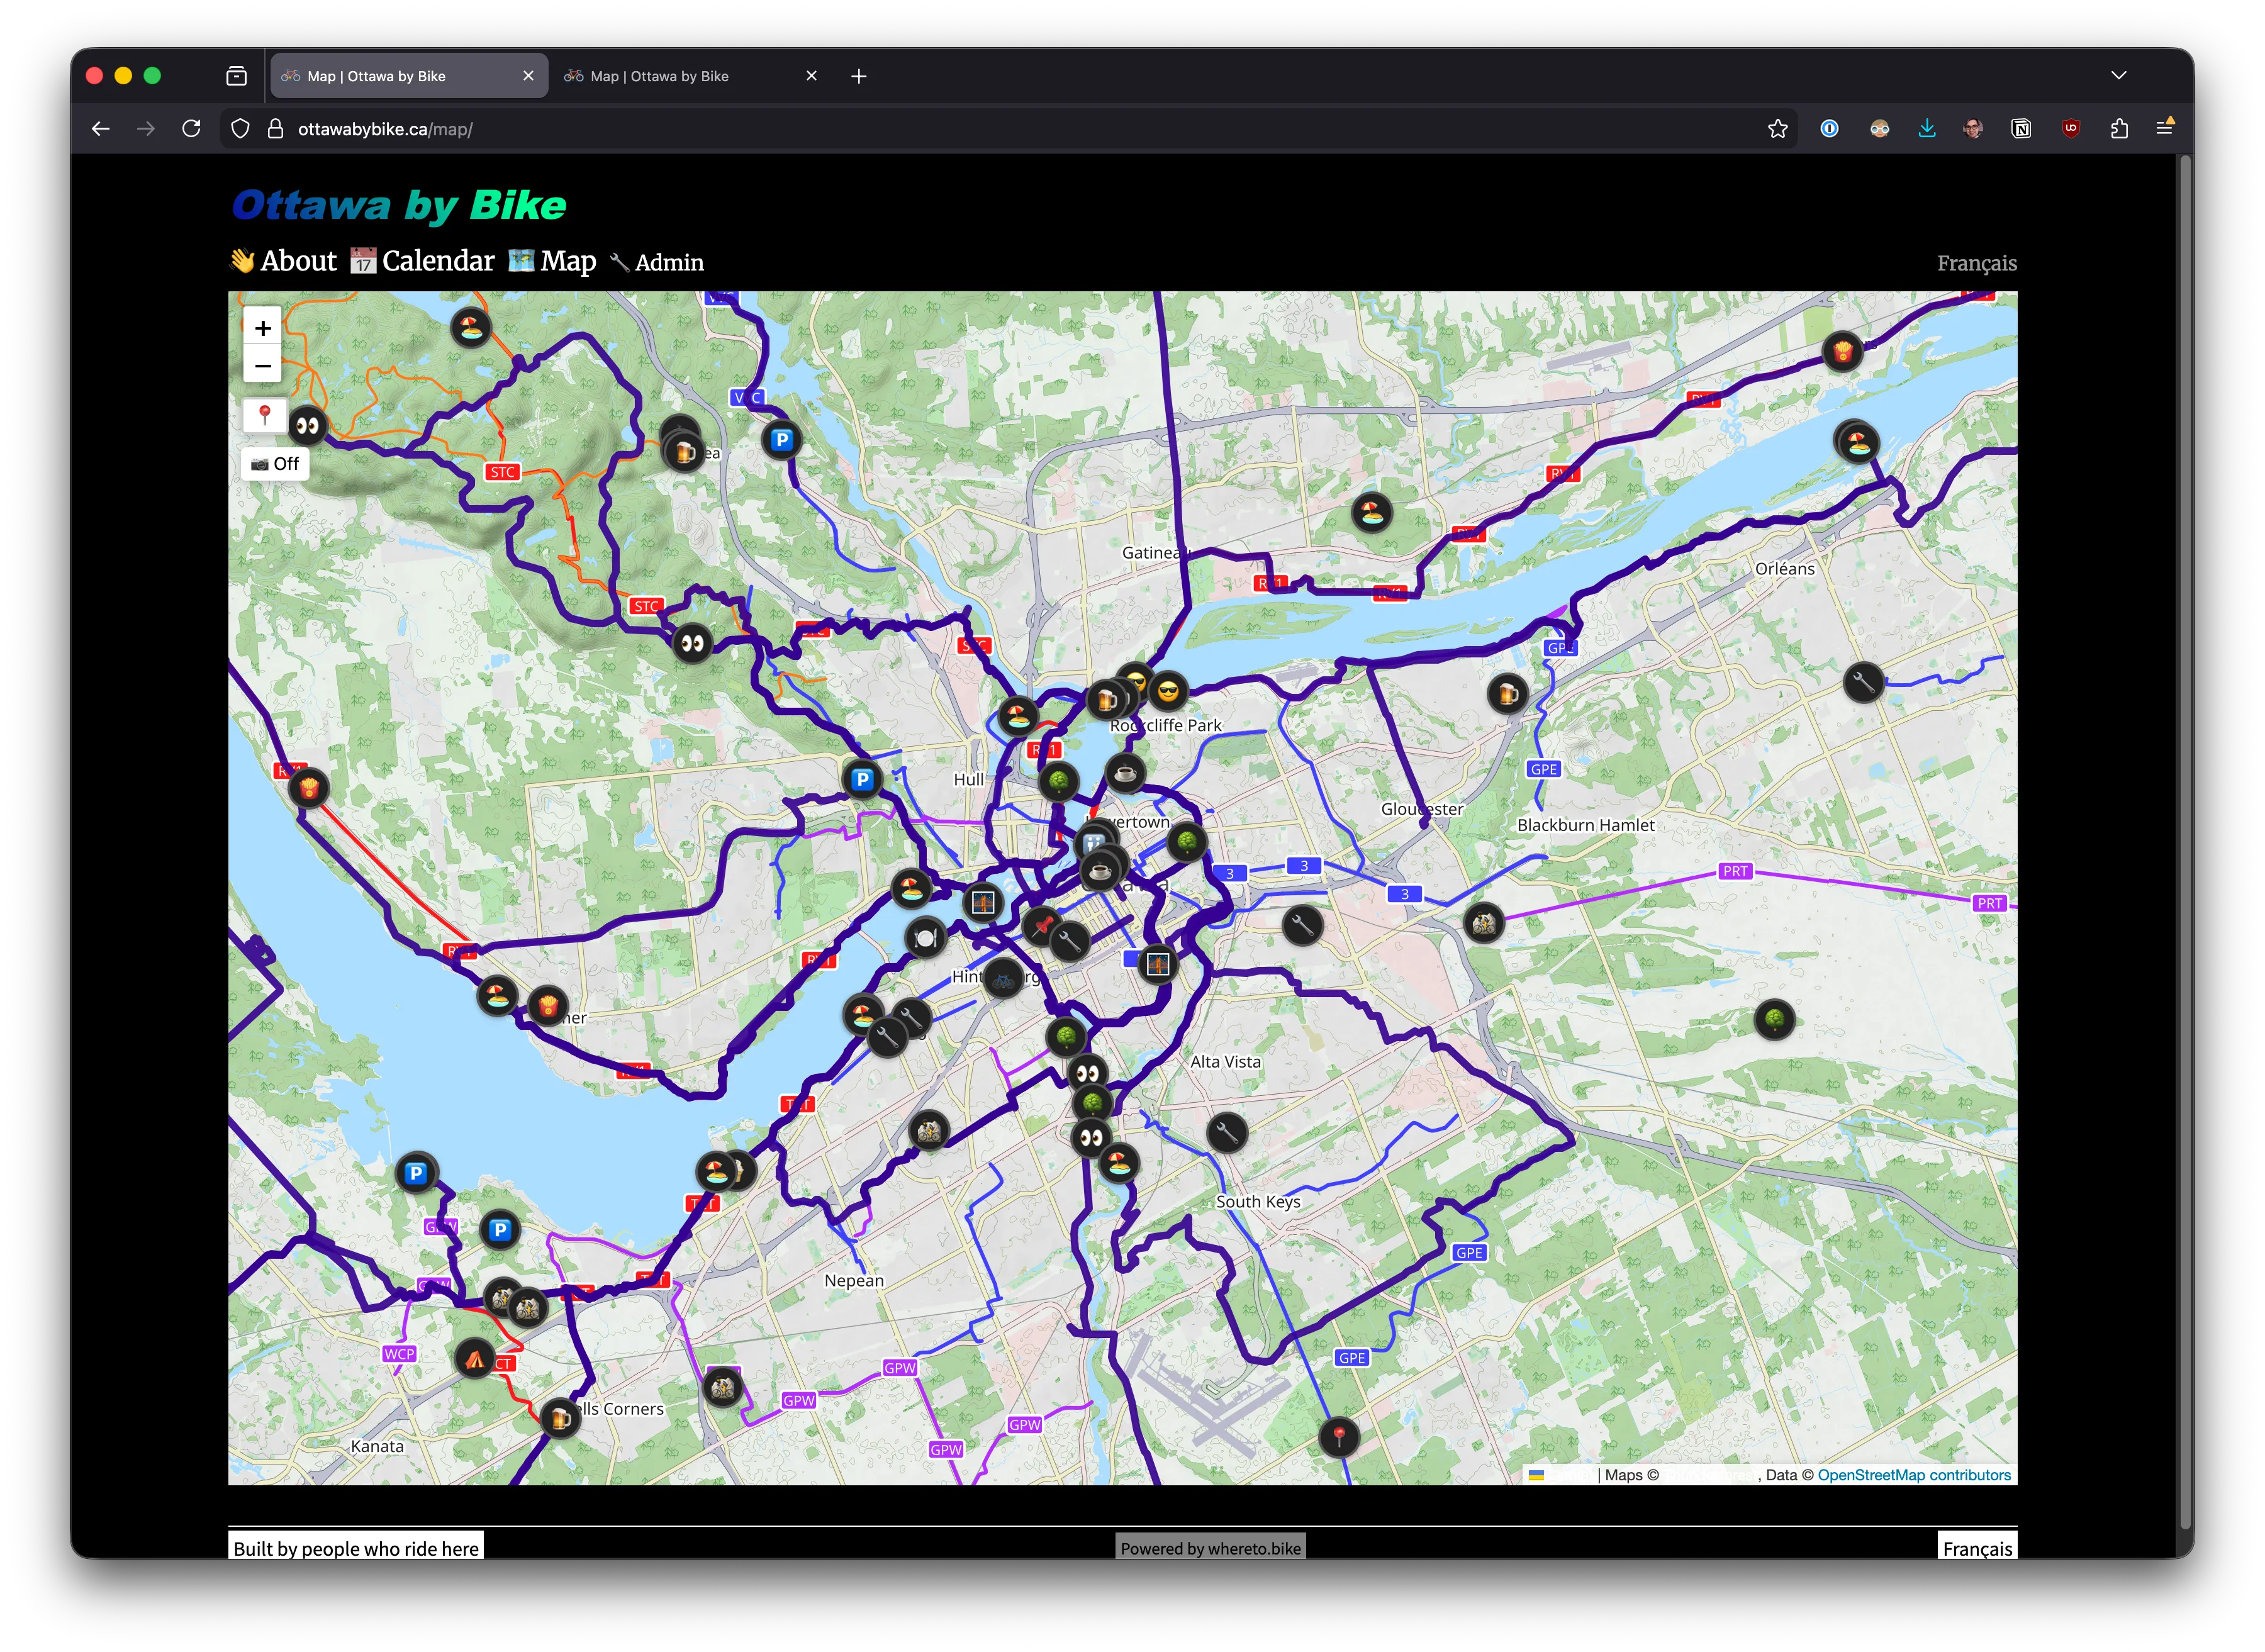
The same zoom on standard tiles. The cycling network is there in the data, but it doesn’t read as a system — just scattered blue lines among everything else:
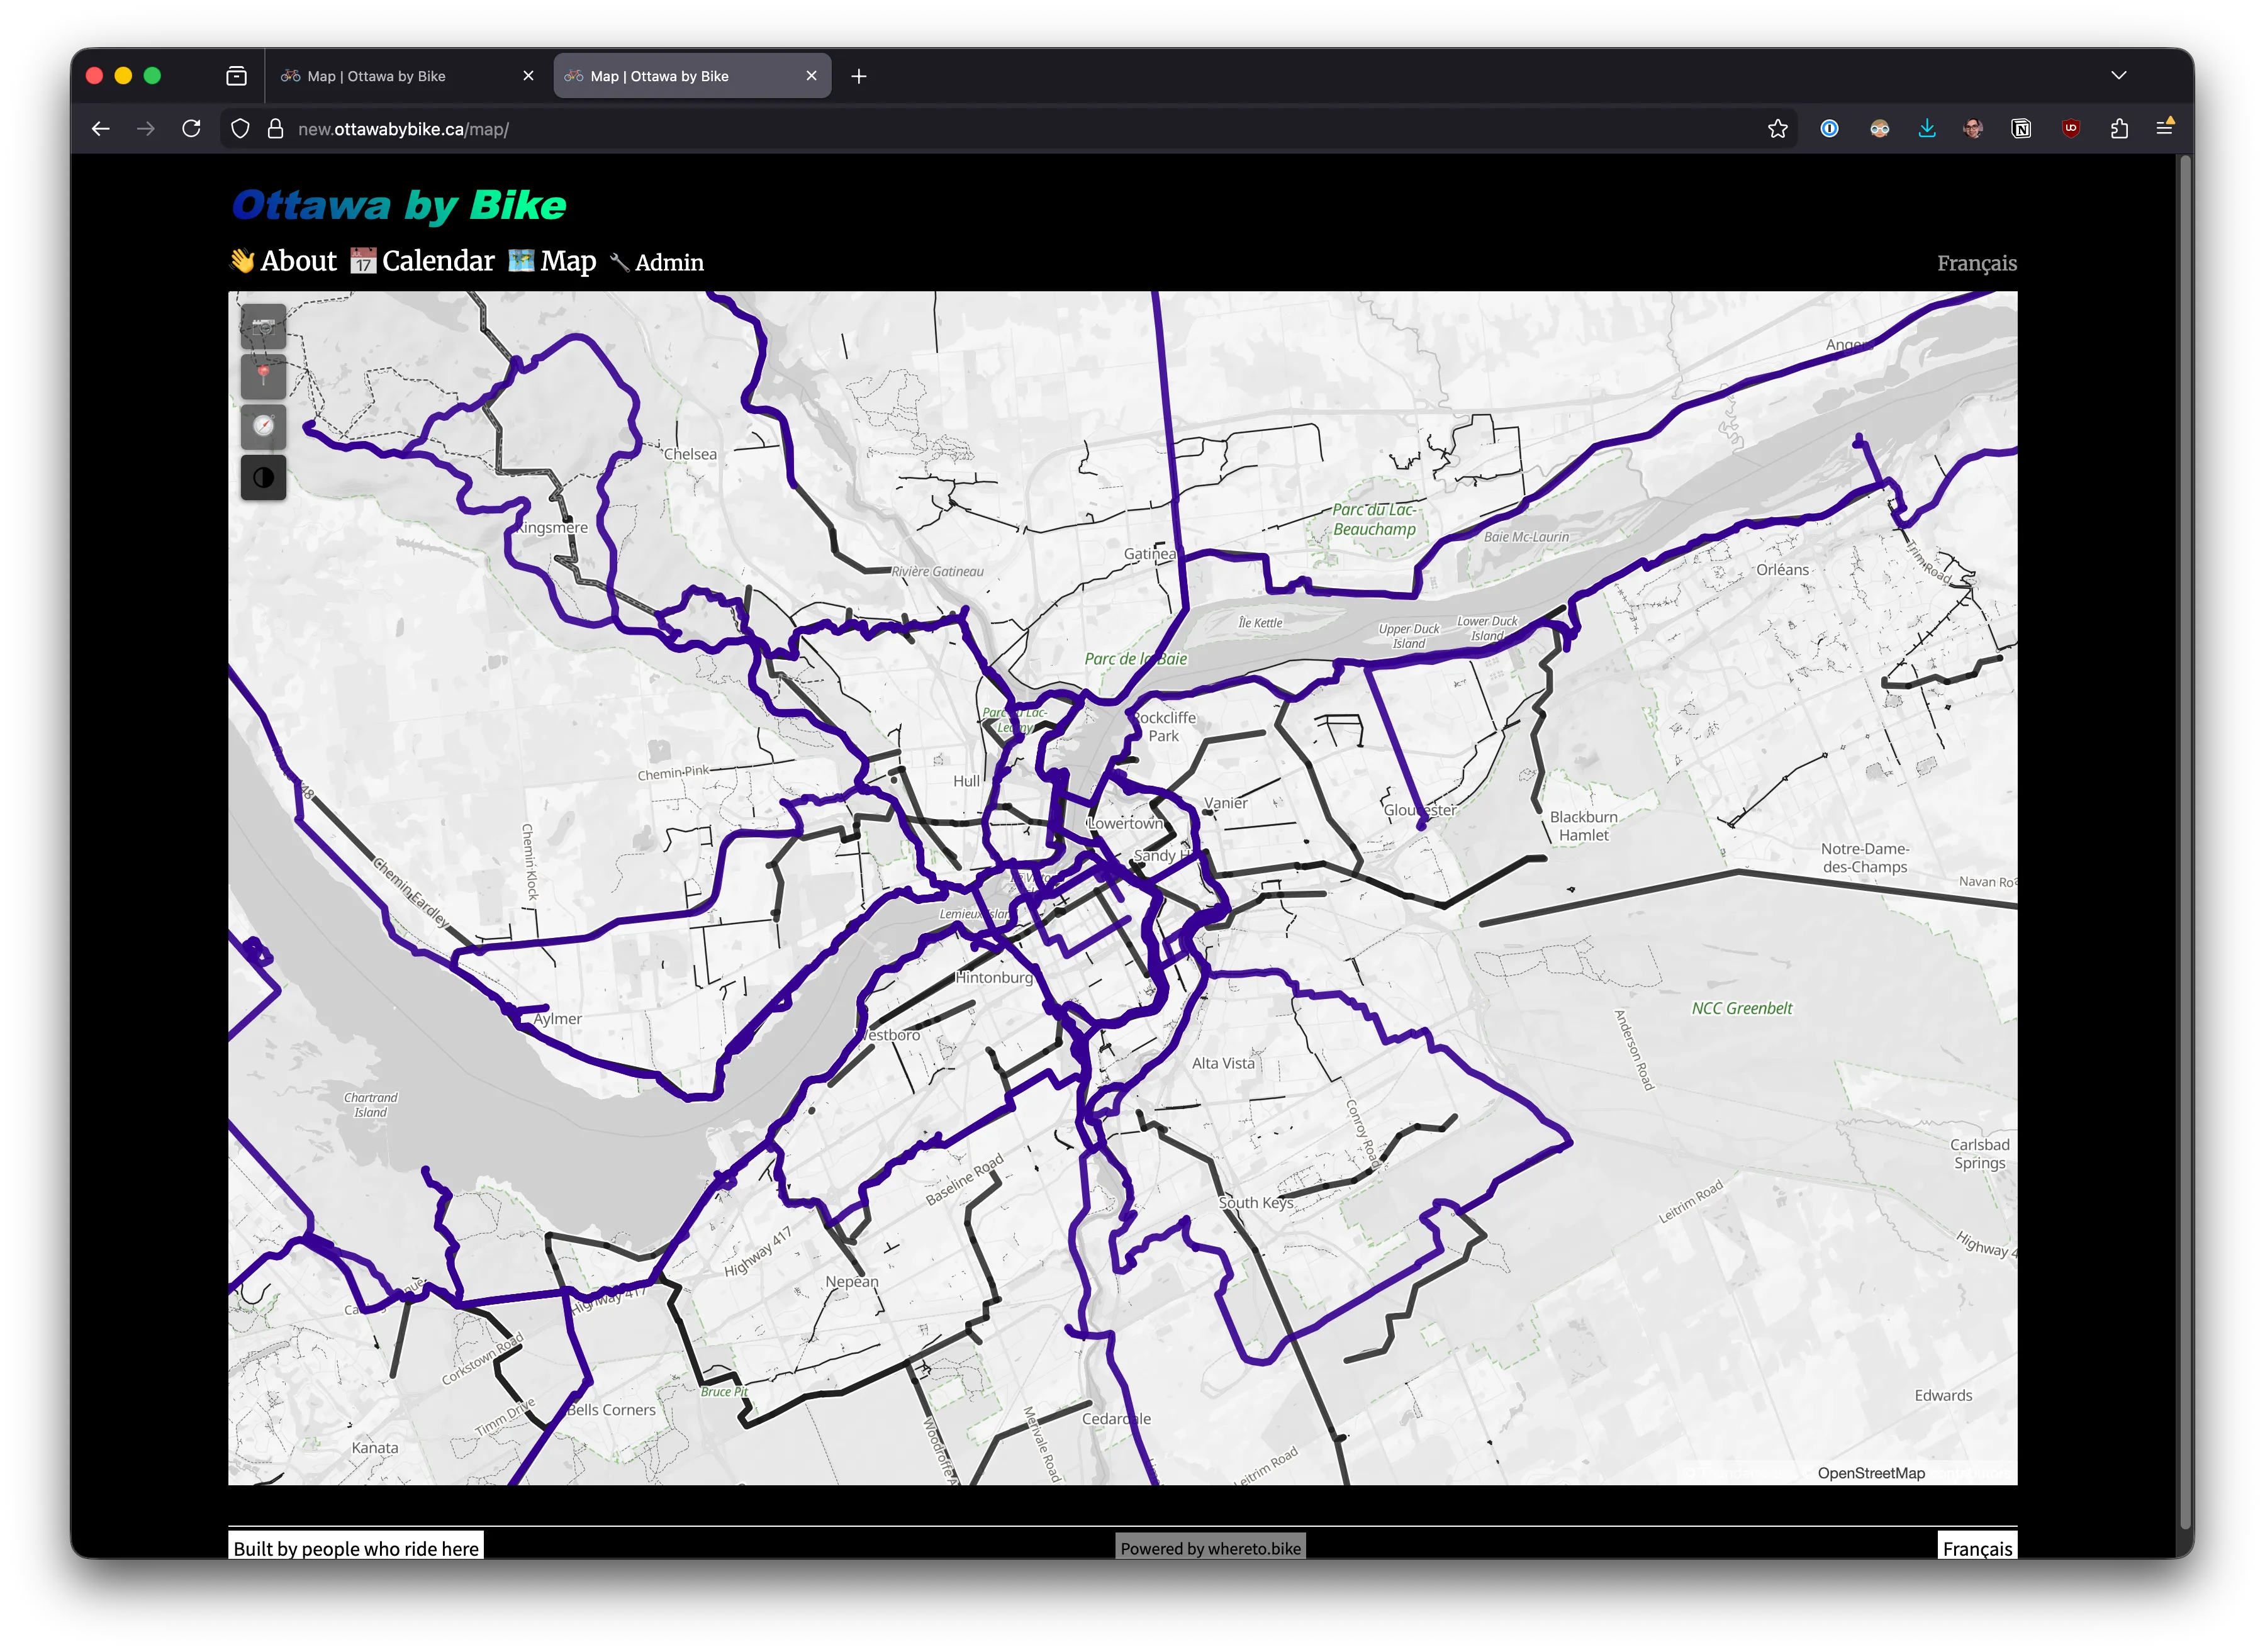
High-contrast variant
Section titled “High-contrast variant”Not everyone sees colour the same way. The high-contrast variant encodes all information through line weight and dash patterns rather than colour:
- Almost monochrome. Paper-like. Black lines on white.
- Oasis paths are thick and solid. Exposed lanes are dashed. Car roads are thin.
- Every piece of data present in the default map is present here — nothing is lost, just encoded differently.
How it works
Section titled “How it works”The map style is generated from a TypeScript script (scripts/build-map-style.ts) that outputs MapLibre GL style JSON. It renders Thunderforest outdoors-v2 vector tiles built on OpenStreetMap data.
The entire style is code. Colours live in palette objects. Line widths are zoom-interpolated. POI categories map to tiers. Both variants — the warm default and the high-contrast — share the same layer structure; only the palette differs. Version-controlled, reviewable, reproducible.
Why this matters
Section titled “Why this matters”A map is a statement about what matters. Ours says cycling matters.
When someone opens a route page, the map should make cycling feel like a real, supported way to move through a place. The teal paths say: this infrastructure exists, and it connects to places worth going.